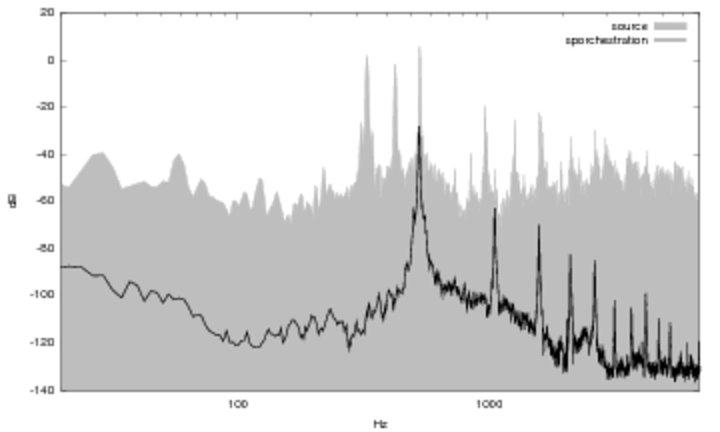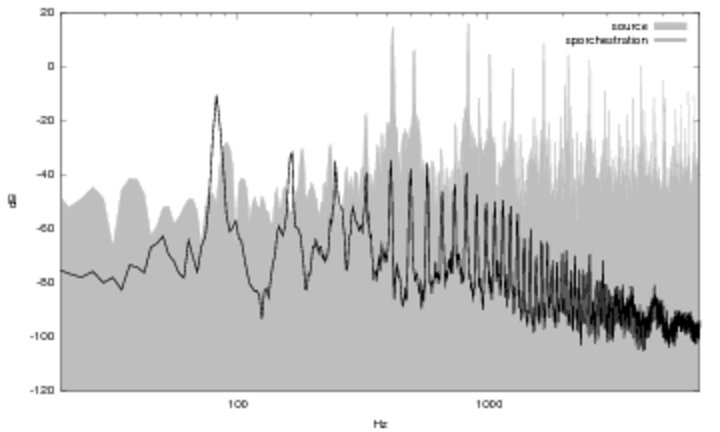
Figure 2.1: Boat Whistle Source and Sporchestration
Next: Percussion Instruments, Previous: The Search, Up: How it Works
The following figures show spectral analyses of the first few selections in a sample run of SPORCH. The sources are represented by the gray background plots and the orchestration is represented by the dark black lines. The plot is logarithmic with respect to frequency and the orchestrations were attenuated by 30 or 40 dB to make the graphs more readable.
This figure shows superimposed frequency vs. amplitude plots of a boat whistle sound and its orchestration.
The graph shows that the program added at least three peaks (or double peaks) that weren't present in the original source (one at around 90 Hz, another at around 180 Hz and another at 280 Hz). Most of the major frequency components in the source are accounted for, and the contour of each of the two graphs are fairly similar. Exceptions are peaks above 3000 Hz or so which lie outside the majority of pitch ranges for instruments and the extra peaks below 300 Hz.
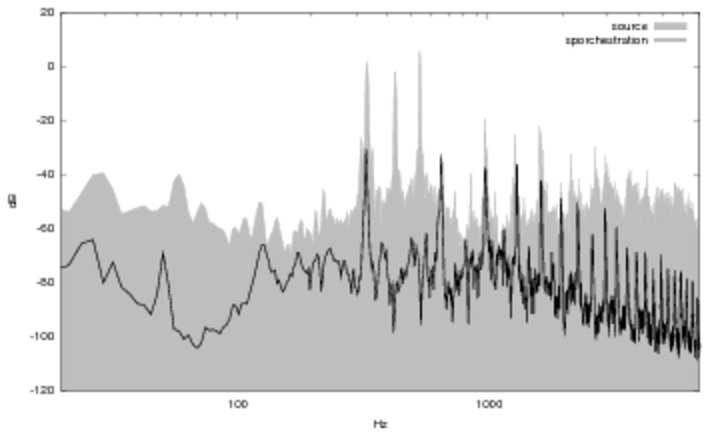
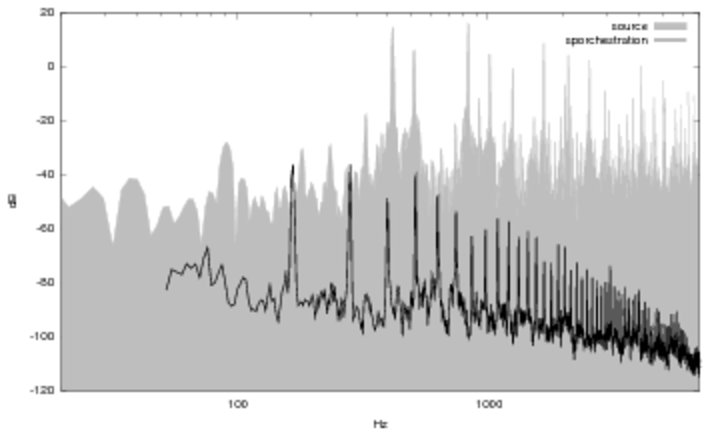
The next figure shows the first match made by the algorithm, which is a horn playing a C5.
The fundamental of the note matches the highest peak in the source and all of the harmonics above the fundamental (with the exception of the second, possibly) match major peaks in the region above it. SPORCH gave this pitch a rating of 60%, which is an exceptional match. Choosing a lower pitch to match one of the large peaks below 500 Hz would have most likely placed the second harmonic at a bad location in the gap between around 550 and 850 Hz.
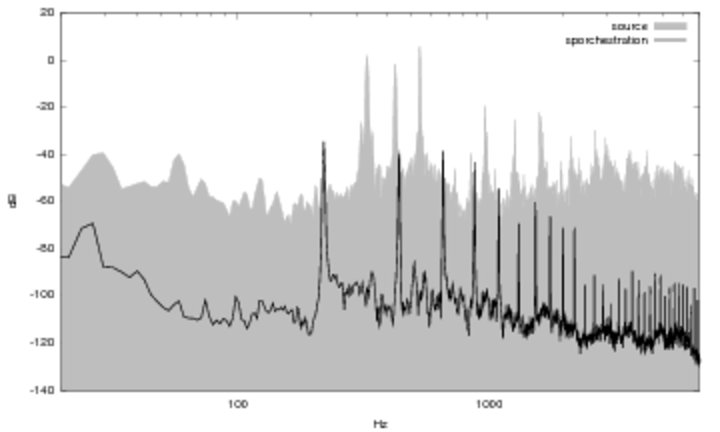
The second match is a viola playing E4.
This knocks out the second highest peak and takes care of all the major peaks above 900 Hz that the horn didn't cover. The match comes at the expense of adding an unwanted component at around 650 Hz which was avoided in the first one. This received a score of 11% possibly for this reason. The third match, a bassoon playing an A3, takes care of the remaining large peak and a smaller one at 200 Hz.
This one received a 12%. The remaining matches are at the lowest dynamic level—two clarinets reinforce the viola E4 note and the rest fill in the area below 200 Hz. The choice of clarinets make sense perhaps because the weak second harmonic in the instrument's spectrum skips over the large unwanted component that was added in the second step. The final score for the entire orchestration was a rating of 56% (a fairly high value), meaning 56% of the source was eliminated in the subtraction procedure.
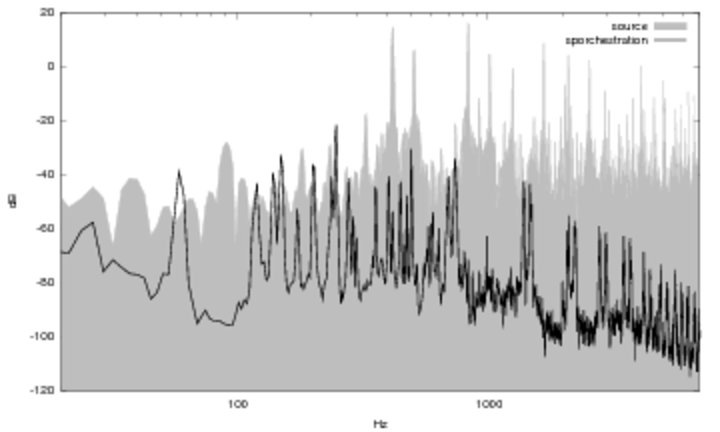
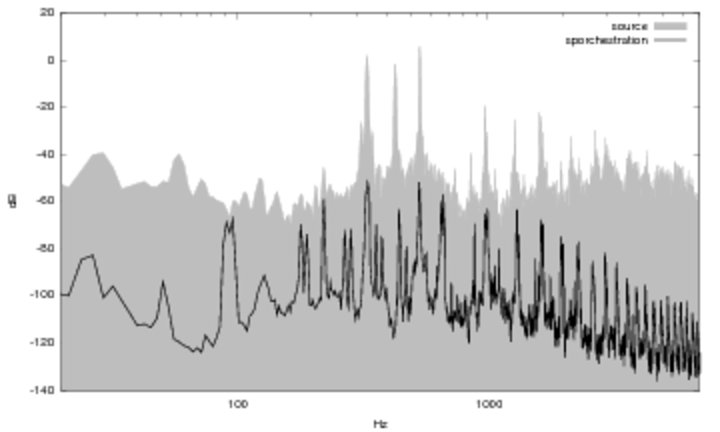
The next figure shows a source spectrum rich in upper partials.
SPORCH was unable to match many of these above 2000 Hz or so, so the overall rating was a low 4%. This figure shows the first match, a cello playing a fortissimo E2.
The large number of partials in this pitch are able to subtract away many of the peaks in the source and cover almost all of the major peaks that occur below 1000 Hz. The second match is the exact same instrument and pitch. The third match is a double bass playing an E3, which reinforces the first two choices and appears to target the source peak at around 500 Hz.
Accuracy is heavily dependent on the input amplitude level compared to the amplitude levels of the instrument samples. The range of dynamic levels allowed also has an effect on the output. If the input amplitude is too high compared to instrument levels, the algorithm compensates by assigning multiple instruments to the same pitch (essentially doubling its selections to attain the dynamic levels that it needs). If the input level is too low, the algorithm selects one instrument/pitch or none at all. An input amplification or attenuation that falls in the middle tends to produce the most variety in the output. The search algorithm can be wrapped inside a loop that searches for this point, adjusting the level until the output contains just the right number of selections.
The output of the program can often be quirky and respond differently to small changes in input. Amplifying or attenuating the input by an even small amount can often make the difference between at least several pitch or instrument choices. This is due to the fact that regardless of all the averaging that is done, the FFT peak data stored in the database is not necessarily consistent from pitch to pitch or dynamic level to dynamic level. Shifting the pitch or amplitude of the input, then, causes changes that don't quite correspond to the input changes in a way one would expect.